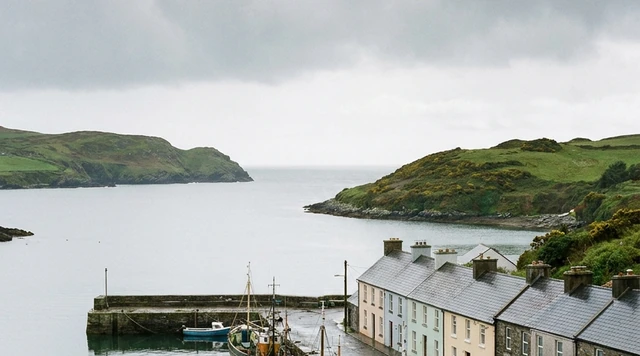
AI illustration
 Edited by
 In the 2024-25 glacier year Iceland's ice caps lost about fifteen billion tonnes of mass, and the researchers who measure them wrote that the period of slower loss which had held since 2012 is over. In the same window, roughly two hundred thousand people walked on or into glacier ice inside Vatnajökull National Park. Both of those numbers are measured. What connects them is harder to measure than most travel writing admits, and this note is an attempt to say exactly how much is known and how much is not.
Desk research, and an interest to declare
This is desk research. Nobody from this publication stood on Breiðamerkurjökull to write it. It is built from the Icelandic Meteorological Office and the University of Iceland, the Icelandic Glaciological Society, the World Glacier Monitoring Service, Vatnajökull National Park, the Icelandic Tourist Board, EU legislation, and peer-reviewed tourism and glaciology research.
The interest is also worth stating first. Hiddencorners publishes travel writing. We describe glacier destinations — D-006, D-009, D-010, D-019 — and a publication that describes them has an obvious reason to prefer conclusions in which visiting is defensible. Some of the evidence below does not. It is here anyway.
The measurements, and where they disagree
Start with the global series. The World Glacier Monitoring Service maintains a set of roughly sixty reference glaciers with continuous records longer than thirty years, drawn from a network in more than forty countries. Their mean annual balance was −1.462 m water equivalent in 2021/22, −1.604 in 2022/23, −1.43 in 2023/24 and −1.357 in 2024/25. Cumulative loss since 1950 exceeds 30 m w.e., and eight of the ten most negative years on record have occurred since 2010.
The satellite-and-field synthesis published in Nature in 2025 by the Glacier Mass Balance Intercomparison Exercise put global loss at 273 ± 16 gigatonnes a year from 2000 to 2023 — 6,542 ± 387 Gt in total, about 5% of the world's glacier ice, and 18 ± 1 mm of sea-level rise. The rate rose 36 ± 10% between the first and second halves of that period, and 2023 alone cost 548 ± 120 Gt.
Now Iceland, where two credible sources point in different directions. The GlaMBIE synthesis, running to 2023, identified a slowdown of mass loss in Iceland and Scandinavia, attributed to regional cooling and heavier winter precipitation. That matches the peer-reviewed Icelandic record: Aðalgeirsdóttir and colleagues found a mean of −9.6 ± 0.8 Gt a year across 1994/95 to 2018/19, with the post-2010 rate about 50% lower than the years before it.
Then the 2024-25 glacier year arrived. On 29 January 2026 the Icelandic Meteorological Office, the Institute of Earth Sciences, Landsvirkjun and the Icelandic Institute of Natural History reported that Iceland's glaciers had lost about 15 gigatonnes — roughly 11 Gt from Vatnajökull and about 3 Gt from Hofsjökull and Langjökull together — and stated plainly that the slower period of 2012 to 2020 had ended. Their diagnosis was specific: an unusually warm autumn and winter meant 27% of Vatnajökull's winter precipitation fell as rain, the highest share since 2016-17; accumulation landed in the lowest quartile of the past thirty years; and the summer of 2025 was among the warmest measured. In the WGMS tables, Vatnajökull's balance moves from −0.384 m w.e. in 2023/24 to −1.23 in 2024/25, and Eyjabakkajökull from −0.51 to −2.43.
So: a documented slowdown to 2023, and a documented end to that slowdown in the year after the synthesis closed. Anyone quoting the encouraging half of that pair without the other half is quoting a period, not a trend.
The longer Icelandic record is not ambiguous. About 2,200 km² of glacier area has gone since the end of the Little Ice Age around 1890, roughly 750 km² of it since 2000. The Met Office puts recent area loss near 40 km² a year, about 0.3% of area and up to 0.5% of volume annually, and Vatnajökull National Park expects Icelandic glaciers to lose about half their volume by 2100. On attribution the literature has moved: Roe, Christian and Marzeion put the central estimate for industrial-era glacier mass loss at essentially 100% anthropogenic, with a likely range of 85 to 130%.
The year the UN named the ice
The United Nations declared 2025 the International Year of Glaciers' Preservation, and UNESCO and the World Meteorological Organization marked the first World Day for Glaciers at UNESCO's Paris headquarters on 20 and 21 March 2025. The framing agencies used was hydrological rather than scenic: glaciers and ice sheets hold about 70% of the world's fresh water, and glacier melt feeds more than two billion people. 2023, they noted, produced the largest glacier mass loss in five decades of record-keeping.
It is worth registering what that designation is and is not. It is an attention mechanism: it does not restrict travel, does not price emissions, and appears nowhere in the mass-balance series above.
Last chance tourism is a literature, not a slogan
The phrase has an academic home. Lemelin, Dawson, Stewart, Maher and Lueck set out last-chance tourism in Current Issues in Tourism in 2010, using Churchill, Manitoba's polar-bear industry as the case. The central finding of the field since then is uncomfortable, and it is quantified.
Dawson, Stewart, Lemelin and Scott surveyed 334 Churchill visitors and interviewed 18 more. Polar-bear viewing produced about 20,892 tonnes of CO₂ in a single season. Most visitors understood that climate change threatened the bears; most did not connect that threat to their own journey. A decade later D'Souza, Dawson and Groulx repeated the study. The 2018 season came in at 23,017 tonnes — higher, not lower — and their conclusion was that awareness had risen while consumption behaviour had not changed, with the same gap between accepting climate change and linking it to air travel.
The tourism that exists because a thing is disappearing emits more, in absolute terms, the better understood the disappearance becomes.
Two further results sharpen it. Piggott-McKellar and McNamara surveyed 235 tourists on the Great Barrier Reef and found that last-chance-motivated visitors did have higher environmental concern — and also ranked tourism itself as only a moderate-to-low threat to the reef. And Salim and Ravanel, studying Montenvers–Mer de Glace in the French Alps, found that respondents with greater climate-change awareness rated last-chance motivations as more important. Awareness, in that sample, was not a brake. It was an accelerator on the decision to travel.
What popular coverage gets wrong
The awareness argument
The standard defence of glacier travel is that seeing the ice makes people care, and caring makes them act, so the trip is net-positive. It is a claim about a causal chain, and each link is testable.
The first link holds: visitors do arrive concerned, and glacier sites do produce strong emotional response. The second link is where the evidence stops. The Churchill decade review is the closest thing the field has to a controlled before-and-after on this exact question, and it found consumption behaviour largely unchanged across ten years of rising awareness. The reef study found last-chance visitors discounting tourism as a threat. The Mer de Glace study found awareness correlating with a stronger urge to go. We could not locate a peer-reviewed study demonstrating that visiting a glacier produces a measurable, durable reduction in the visitor's own emissions.
What would settle it is not complicated: a longitudinal design following identified visitors for several years afterwards, measuring flights taken rather than intentions stated, against a matched control group. Until someone runs it, "raising awareness" is a hypothesis with contrary evidence beside it. The honest version is narrower: witnessing may change what a person says and votes for. There is no published evidence it changes what they fly.
The offset claim
The second thing to distrust is any operator whose tour is advertised as carbon-neutral because it is offset. The largest systematic assessment to date — Probst and colleagues, in Nature Communications in 2024 — synthesised 14 studies covering 2,346 carbon-crediting projects and roughly 972 million issued credits, about a fifth of the global total. Their finding was that fewer than 16% of the credits studied represent real emission reductions; roughly 812 million tonnes of claimed reductions likely did not occur. Performance by type ranged from 68% for HFC-23 abatement down to statistically insignificant for wind power and forest management.
Regulators have caught up with this faster than marketing has. Directive (EU) 2024/825 inserts a new point 4c into the blacklist of unfair commercial practices: "Claiming, based on the offsetting of greenhouse gas emissions, that a product has a neutral, reduced or positive impact on the environment in terms of greenhouse gas emissions." Member states had to adopt the measures by 27 March 2026 and apply them from 27 September 2026 — six weeks after this piece was published. An operator still selling neutrality-by-offset in October 2026 is selling something that will by then be a prohibited claim across the EU.
The arithmetic of arriving
Emission factors used by the UK government, and reproduced by Our World in Data, put short-haul flying at about 154 g CO₂e per passenger-kilometre and domestic flying at 246 g, with a 1.9 multiplier already applied for non-CO₂ effects at altitude. Great-circle distance from London to Keflavík is roughly 1,890 km, so a return trip is around 0.58 t CO₂e per passenger. New York to Keflavík is about 4,200 km each way — roughly 1.3 t return. London to Patagonia, via Santiago and on to Punta Arenas, is on the order of 13,800 km each way, or roughly 4 t CO₂e returning. Those are our own calculations from great-circle distances and published factors; real routings are longer and long-haul factors per kilometre are lower, so treat them as magnitudes rather than measurements.
For context on the sector: Sun and colleagues put global tourism at 5.2 Gt CO₂e in 2019, 8.8% of world greenhouse gas emissions, growing 3.5% a year over the previous decade — about twice the rate of the global economy — with aviation making up 52% of tourism's direct emissions.
What cannot honestly be done is the conversion everyone wants: this many tonnes of my CO₂ equals this many tonnes of Icelandic ice. No published study makes that attribution for glaciers. The one place the physics has been reduced to a per-emission constant is Arctic sea ice, where Notz and Stroeve established a linear relationship between cumulative CO₂ emissions and September sea-ice area. Glacier response is governed by ice dynamics and response times of decades to centuries, which is why Roe and colleagues can attribute the aggregate loss with confidence while nobody attributes one flight to one crevasse. Anyone offering you that number invented it.
25 August 2024
On 25 August 2024 an ice wall collapsed at an ice cave on Breiðamerkurjökull, inside Vatnajökull National Park, during an organised tour. A United States national was killed and his wife seriously injured. Early reporting described two people missing beneath the ice; the search was called off when rescuers established that the group numbered 23 rather than the 25 first assumed, and that nobody was under the ice at all.
Ten days later, on 4 September 2024, eight glaciologists from the Met Office and the University of Iceland sent the minister a memorandum on visitor safety near glaciers. It cited a 2017 assessment concluding that summer ice-cave tours are dangerous and that people should not enter caves in that season. The reasoning is structural: ice caves are drainage conduits, so meltwater can arrive with almost no warning; caves near geothermal areas can carry hydrogen sulphide; and surfaces give way on warm, sunny, windy or rainy days, with ablation on many lowland outlet glaciers near ten metres a year. The park asked operators to suspend ice-cave tours, and all of them complied.
What the regulation actually did
The following spring the park's professional advisory board proposed closing the caves from 15 April to 15 October; some operators argued for a different window. What emerged is a season running from October with the caves closed roughly May through September — the last tours of 2025 ran on 30 April. Operators in the park must hold day-tour permits from the Icelandic Tourist Board and their own safety plans, designate experienced lead guides who assess each cave daily, avoid sites judged unsafe, fund a professional council through a per-client fee, and waive compensation claims against the park when access is restricted. Guide-to-guest ratios sit between 8 and 16, and the national nature conservation authority may cap numbers if crowding demands it.
Two things follow that are rarely said together. First, the rules apply inside Vatnajökull National Park. Ice-cave tourism on glaciers outside it — the Mýrdalsjökull and Langjökull systems among them — remained, as of April 2025, legal and unregulated, with the Tourist Board's safety expert pointing to the responsibility of the companies themselves. Second, safety and access are not opposed here so much as traded: a shorter permitted season concentrates the same demand into fewer months, which is a pressure on the same operators the rules are meant to discipline. Guides quoted after the accident recommended caves be visited only between December and March, which is narrower still than the rule that was adopted.
The money
The dependence is real and it is local. Iceland recorded about 2.26 million foreign departures through Keflavík in the twelve months to June 2026, essentially flat on the year before at −0.2%; the calendar year 2025 ran near 2.28 million, of which 28.8% were Americans. Against that, the chair of Vatnajökull National Park's board described roughly 200,000 people taking glacier hikes or ice-cave tours in the park in a single season. That is one visitor in eleven arriving in the country, concentrated into a thinly populated stretch of the south-east.
We could not source a reliable figure for glacier tourism's share of employment or turnover in Suðurland or Hornafjörður, and we are not going to estimate one. What can be said is that the instrument the park chose — per-client fees funding the professional council — makes the safety system's budget a direct function of visitor numbers.
What a visitor can and cannot change
Cannot: the mass balance. A traveller's presence or absence has no measurable effect on any number in the first half of this piece. The single largest variable a visitor controls is whether and how far they fly, and that decision is made before any operator is chosen.
Can, concretely:
- Go guided, always. Every source above that touches safety says the same thing, and the one fatality in this record happened on a commercial tour, not to a lone walker — which is an argument for better guiding, not against guiding.
- Ask which season the operator will refuse to work in, and treat a company that never cancels as a warning rather than a convenience.
- Prefer operators inside the regulated area, or ask an operator outside it what standard they hold themselves to in the absence of one.
- Discount offset claims to roughly zero, and note that they become an unlawful commercial claim in the EU from 27 September 2026.
- Reduce trip count rather than trip length. The emissions are in the flying, not the days.
- Fund the measurement. The records that make this article possible are kept in part by the Icelandic Glaciological Society, founded in 1950, whose volunteers still run the expeditions and whose journal, Jökull, publishes the results.
Our position
We are not going to tell you that visiting is fine because it raises awareness, because the peer-reviewed evidence we could find does not support that chain. We are also not going to tell you to stay home, because the trade — several hundred kilograms of CO₂e against a local economy, a rescue infrastructure and a monitoring culture that exists partly because the ice is visited — has real quantities on both sides, and the judgement is yours. What a travel publication can honestly do is put the quantities where you can see them, name the study that would settle the open question, and stop selling absolution.
Corner Codex — M-005
- Scope
- Every glacier destination in the journal — D-006, D-009, D-010, D-019 and onward
- Iceland, 2024-25 glacier year
- About 15 gigatonnes lost; roughly 11 Gt of it from Vatnajökull
- Iceland, long record
- About 2,200 km² of ice gone since ~1890; about 750 km² of that since 2000
- Global reference glaciers
- −1.357 m water equivalent in 2024/25; over 30 m w.e. lost since 1950
- Global glacier loss 2000–2023
- 273 ± 16 Gt a year; 18 ± 1 mm of sea-level rise
- Attribution
- Central estimate: essentially 100% of industrial-era loss is anthropogenic
- The fatal accident
- Breiðamerkurjökull ice cave collapse, 25 August 2024 — one dead, one injured
- The regulatory answer
- Ice caves in Vatnajökull National Park now closed roughly May to September
- Scale of the activity
- About 200,000 glacier-hike and ice-cave participants in the park in a season
- A return flight, London–Keflavík
- About 0.58 t CO₂e per passenger, non-CO₂ effects included
- What the offsets are worth
- Under 16% of assessed carbon credits represent real reductions
- Silence Index
- — not scored. This is a method note, not a place
The Traveler's Panel · checked
Changing information. Prices, permits, seasons and road access change, sometimes at short notice. Everything here is a starting point for your own confirmation — not a quote, and not a guarantee. Verify with the operator and the relevant official body before you book.
| Choosing an operator | Ask for the training standard by name · small groups · published cancellation terms · no 'guaranteed cave' marketing · no carbon-neutral claims |
| Season logic | Ice caves inside Vatnajökull National Park run from October, closed roughly May to September; glacier walks run year-round with the guide's judgement on the day |
| Outside the park | Ice-cave tourism on other glaciers was still unregulated as of April 2025 — the standard is whatever the company sets itself |
| The numbers to know | Iceland lost ~15 Gt of ice in 2024-25; ~200,000 people take glacier tours in the park each season |
| Check first | vatnajokulsthjodgardur.is for park rules · vedur.is for conditions and monitoring · the operator's own daily status page |
Safety & responsible travel
- Go guided on any glacier surface, in any season. The one death in this record happened on a commercial tour, which is an argument for better guiding rather than against it.
- Book refundable and let the glacier cancel. An operator that never turns back is advertising a risk posture, not a service level.
- Treat carbon-neutral-by-offset claims as worthless: fewer than 16% of assessed credits represent real reductions, and the claim becomes a prohibited commercial practice across the EU from 27 September 2026.
- Reduce the number of trips rather than their length. Aviation is 52% of tourism's direct emissions, and the flight is decided before the operator is.
- Do not repeat the claim that visiting 'raises awareness' and is therefore net-positive. The peer-reviewed record shows awareness rising and travel behaviour unchanged.
- Take nothing off the ice and leave nothing on it. Meltwater concentrates whatever is left behind into the water below.
Sources & further reading — checked
- World Glacier Monitoring Service — Global glacier state. Reference glaciers losing more than 1 m w.e. a year over the last three years; cumulative loss above 30 m w.e. since 1950; eight of the ten most negative years recorded after 2010; network spanning more than 40 countries
- World Glacier Monitoring Service — Latest glacier mass balance data. Reference-glacier annual means of −1.462 m w.e. (2021/22), −1.604 (2022/23), −1.43 (2023/24) and −1.357 (2024/25), and the per-glacier Icelandic values including Vatnajökull at −0.384 then −1.23 and Eyjabakkajökull at −0.51 then −2.43
- GlaMBIE Team — Community estimate of global glacier mass changes from 2000 to 2023, Nature (2025). Global loss of 273 ± 16 Gt a year and 6,542 ± 387 Gt in total; about 5% of global glacier ice; 18 ± 1 mm of sea-level rise; a 36 ± 10% increase in rate between 2000–2011 and 2012–2023; 548 ± 120 Gt in 2023 alone; and the reported slowdown in Iceland and Scandinavia over the period
- Veðurstofa Íslands — Íslenskir jöklar rýrnuðu um 15 milljarða tonna 2024-2025 (29 January 2026). The 2024-25 loss of about 15 Gt, roughly 11 Gt of it from Vatnajökull and 3 Gt from Hofsjökull and Langjökull; the statement that the slower period of 2012–2020 has ended; rain at 27% of Vatnajökull's winter precipitation; accumulation in the lowest quartile of 30 years; and the warm summer of 2025
- Aðalgeirsdóttir et al. — Glacier changes in Iceland from ~1890 to 2019, Frontiers in Earth Science 8 (2020). Area loss of ~2,200 km² since the end of the Little Ice Age and ~750 km² since 2000; mass change of −240 ± 20 Gt across 1994/95–2018/19, or −9.6 ± 0.8 Gt a year; ice volume of ~3,400 km³ in 2019, about 9 mm of sea-level equivalent; and a post-2010 loss rate about 50% lower than before
- Icelandic Meteorological Office — Glaciers in Iceland continue to retreat. Area loss averaging about 40 km² a year in recent years, more than 600 km² since 2000 and about 2,000 km² since the end of the 19th century, with roughly 250 km³ of ice lost since 1995
- Veðurstofa Íslands — Jöklamælingar (glacier monitoring). The monitoring programme's structure — mass balance, glacier terminus variations, outburst floods and mapping — and the figures of roughly 0.3% of area and up to 0.5% of volume lost annually
- Veðurstofa Íslands — Jöklar á Íslandi rýrna enn. The joint monitoring partnership of the Met Office, the Institute of Earth Sciences, the Icelandic Glaciological Society, the South-East Iceland Nature Centre and Vatnajökull National Park; ~250 km³ lost since 1995; and 2017 terminus retreat of 200–300 m at Breiðamerkurjökull
- Jöklarannsóknafélag Íslands (Icelandic Glaciological Society). The society's founding in 1950, its volunteer measurement expeditions on Vatnajökull and elsewhere, the peer-reviewed journal Jökull, and the Jöklavefsjá glacier web map maintained with state agencies
- Roe, Christian & Marzeion — On the attribution of industrial-era glacier mass loss to anthropogenic climate change, The Cryosphere 15 (2021). The central estimate that essentially 100% of observed industrial-era glacier mass loss is anthropogenic, with a likely range of 85–130% for alpine valley glaciers
- UNESCO — UNESCO and WMO launch the International Year of Glaciers' Preservation 2025. The UN General Assembly's proclamation of 2025 as the International Year of Glaciers' Preservation; the first World Day for Glaciers marked at UNESCO Paris on 20–21 March 2025; ~70% of global fresh water held in glaciers and ice sheets; over two billion people supplied; and 2023 as the largest mass loss in five decades of records
- Vatnajökull National Park — Melting glaciers. Glaciers covering about 10% of Iceland; exceptionally fast outlet-glacier retreat since 2000; mass loss among the highest recorded anywhere; and the projection of roughly half the volume lost by 2100
- Vatnajökull National Park — Tilkynning vegna slyss á Breiðamerkurjökli (26 August 2024). The park's official statement that an ice wall collapsed during an organised group tour; the requirement that operators hold day-tour permits from the Tourist Board and their own safety plans; the request that all ice-cave tours stop, with which every operator complied
- Icelandic Met Office and University of Iceland glaciology group — Minnisblað: Öryggi ferðafólks á og við jökla (4 September 2024). Eight glaciologists' memorandum to the minister citing a 2017 assessment that summer ice-cave tours are dangerous and should not be undertaken; the mechanisms — meltwater surges, hydrogen sulphide near geothermal areas, surface collapse in warm, sunny, windy or wet weather; and ablation near 10 m a year on lowland outlet glaciers
- Iceland Review — Search Called Off, No Tourists Under Ice (26 August 2024). The collapse date of 25 August 2024; one US national killed and his wife seriously injured; and the correction of the initial 'two missing' reports once the group was established at 23 rather than 25
- Iceland Review — Stricter Safety Rules Imposed for Vatnajökull Ice-Cave Tours. The new contract conditions: designated experienced lead guides assessing caves daily, avoidance of sites judged unsafe, a professional council funded by per-client fees, and operators waiving compensation claims against the park for access restrictions
- Iceland Review — Ice Cave Tours Unregulated Beyond Vatnajökull (3 April 2025). The summer ban inside the national park with the last tour on 30 April 2025, and the fact that ice-cave tourism on glaciers outside the park remained legal and unregulated, with the Tourist Board's safety expert pointing to operators' own responsibility
- The Reykjavík Grapevine — Debate Over Five- Or Six-Month Summer Halt On Ice Cave Tours (11 March 2025). The professional advisory board's proposed closure from 15 April to 15 October, the competing operator proposals, and the fact that the decision rested with the park authorities
- The Reykjavík Grapevine — Visitor Numbers May Be Limited On Vatnajökull Ice Cave Tours (16 September 2025). About 200,000 people taking glacier hikes or ice-cave tours in the park in a season; the season beginning in October with caves closed May to September; guide ratios of 8–16 guests; the nature conservation authority's power to cap numbers; and contracts moving from two years to five
- Icelandic Tourist Board — Tourism in Iceland in Figures, December 2025. 2,275,663 foreign departures via Keflavík in the twelve months to November 2025, up 0.9%, with the United States at 28.8% of departures and an average stay of 7.0 nights
- Icelandic Tourist Board — Tourism in Iceland in Figures, July 2026. 2,259,357 foreign departures via Keflavík in the twelve months to June 2026, a change of −0.2% on the preceding twelve months
- Association of Icelandic Mountain Guides — Hard Ice glacier guide training. The Hard Ice 1–3 certification ladder, the four-day Hard Ice 1 course held on outlet glaciers, and its prerequisites in crampon technique, ice-screw anchors, rope work and crevasse rescue
- Lemelin, Dawson, Stewart, Maher & Lueck — Last-chance tourism: the boom, doom, and gloom of visiting vanishing destinations, Current Issues in Tourism 13(5), 2010. The paper that established last-chance tourism as a research object, using Churchill's polar-bear industry and the marketing of imminent loss
- Dawson, Stewart, Lemelin & Scott — The carbon cost of polar bear viewing tourism in Churchill, Canada, Journal of Sustainable Tourism 18(3), 2010. 334 on-site surveys and 18 interviews; about 20,892 t CO₂ generated in a single viewing season; and visitors who recognised the threat to the bears while being largely unaware of their own contribution
- D'Souza, Dawson & Groulx — Last chance tourism: a decade review of a case study on Churchill, Manitoba's polar bear viewing industry, Journal of Sustainable Tourism, 2021. Emissions of about 23,017 t CO₂ in the 2018 season, higher than the 2008 baseline, with the finding that awareness had risen while consumption behaviour remained largely unchanged and few tourists connected air travel to the impacts
- Piggott-McKellar & McNamara — Last chance tourism and the Great Barrier Reef, Journal of Sustainable Tourism 25(3), 2016. A survey of 235 on-site tourists finding that last-chance-motivated visitors had heightened environmental concern while ranking tourism and fishing as only moderate-to-low threats to the reef
- Salim & Ravanel — Last chance to see the ice: visitor motivation at Montenvers-Mer-de-Glace, French Alps, Tourism Geographies, 2020. Europe's most-visited glacier site; five motivation factors including urgency and witnessing change; and the finding that respondents with greater climate-change awareness rated last-chance motivations as significantly more important
- Notz & Stroeve — Observed Arctic sea-ice loss directly follows anthropogenic CO₂ emission, Science, 2016. The linear relationship between cumulative CO₂ emissions and September Arctic sea-ice area — the one cryosphere variable for which a per-emission constant exists, and the contrast with glaciers, for which it does not
- Probst et al. — Systematic assessment of the achieved emission reductions of carbon crediting projects, Nature Communications 15:9562 (2024). 14 studies covering 2,346 projects and about 972 million credits, roughly a fifth of the global total; fewer than 16% of credits representing real reductions; and roughly 812 Mt of claimed reductions that likely did not occur
- EUR-Lex — Directive (EU) 2024/825 on empowering consumers for the green transition. New point 4c of Annex I to Directive 2005/29/EC prohibiting claims, based on offsetting, that a product has a neutral, reduced or positive greenhouse gas impact; transposition by 27 March 2026 and application from 27 September 2026
- Our World in Data — What is the carbon footprint of travel?. UK government emission factors of about 154 g CO₂e per passenger-kilometre for short-haul and 246 g for domestic flights, with a 1.9 multiplier applied for non-CO₂ effects at altitude
- Sun, Faturay, Lenzen, Gössling & Higham — Drivers of global tourism carbon emissions, Nature Communications 15:10384 (2024). Global tourism at 5.2 Gt CO₂e and 8.8% of world greenhouse gas emissions in 2019, growing 3.5% a year over 2009–2019, with aviation at 52% of tourism's direct emissions
Official and scientific bodies are the authority for safety, regulatory and scientific claims. Commercial operators are used only for practical detail such as tour length, meeting points and indicative pricing — never for a safety or scientific statement.
How this was made
Desk research. Compiled from official bodies, scientific and conservation sources, established journalism and licensed operators. Not based on a personal visit.
Editor’s method note — what we checked, corrected and could not verify
- Desk research only. Nobody from this publication has been on the ice described here, and no operator was contacted for comment.
- The mass-balance figures were taken from the primary monitoring bodies rather than from press summaries: the World Glacier Monitoring Service tables for the global reference series, the Icelandic Meteorological Office and its partner institutions for Iceland, and the peer-reviewed record for the long-term area and volume history.
- We correct the previous version's headline arithmetic. It gave Icelandic loss as 'roughly 8 billion tonnes of ice a year'. The published mean is −9.6 ± 0.8 Gt a year for 1994/95–2018/19, and the 2024-25 glacier year alone came to about 15 Gt. It also gave '750 km² since 2000' without noting that this figure comes from a study whose record ends in 2019.
- We leave the Iceland disagreement standing rather than resolving it. The 2025 GlaMBIE synthesis reports a slowdown in Icelandic mass loss over 2000–2023; the Icelandic agencies reported in January 2026 that the slower period had ended. Both are correct about their own windows, and quoting either alone misleads.
- The previous version implied the Breiðamerkurjökull collapse simply 'reshaped how winter cave tours are run'. The accident happened in summer, on 25 August 2024, and the regulatory response was specifically to close the caves for the warm months — roughly May to September — while leaving glaciers outside Vatnajökull National Park unregulated. Early reports of two people missing under the ice were wrong and arose from an incorrect group headcount.
- The previous version presented the awareness argument for glacier travel approvingly. We tested it against the last-chance tourism literature and could not support it: the Churchill decade review found behaviour unchanged and emissions higher, the Great Barrier Reef survey found last-chance visitors discounting tourism as a threat, and the Mer de Glace study found awareness correlating with a stronger motivation to travel. We state the study design that would settle the question rather than asserting an answer.
- Flight emissions in this piece are our own arithmetic: published per-passenger-kilometre factors applied to great-circle distances. Real routings are longer, long-haul per-kilometre factors are lower than short-haul ones, and cabin class changes the result substantially. They are presented as magnitudes.
- Several publisher pages for the cited tourism papers refused automated retrieval. Where that happened we verified authorship, year, journal and abstract through the works' catalogue records and cite the DOI, which resolves to the publisher's page.
- Things we could not verify: the share of employment or turnover in Suðurland and Hornafjörður that depends on glacier tourism, which we looked for in Statistics Iceland and Icelandic Tourist Board publications and did not find; whether Directive (EU) 2024/825 has been incorporated into the EEA Agreement and therefore binds Icelandic operators, and on what date; the ministerial working group's November 2024 summary on glacier tours, whose page would not load for us; the number of operators currently holding ice-cave contracts with Vatnajökull National Park; whether the guide-training standards described by the Association of Icelandic Mountain Guides carry any statutory force outside the park's contracts; whether any peer-reviewed study has measured post-visit emissions behaviour in glacier tourists specifically, as opposed to polar-bear or reef tourists; the current status of the police and safety investigations into the 25 August 2024 accident; and whether the 2025 International Year of Glaciers' Preservation produced any measurable change in visitor numbers or operator practice.
AI is used to draft this text, and a human checks it. Tony Hall is responsible for editorial verification against the reference list. Our standard is to distinguish documented facts, disputed accounts and claims we could not verify. Errors can remain; readers can report them through the corrections page. The illustrations are AI-created and labelled as such — no photograph on this site is presented as a record of a real place. Full disclosure · Editorial policy.
Access details change — recheck before you travel. Found an error? Tell us — corrections are dated and shown in place.